Infographics are a great way of communicating complex information and data in a visually pleasing manner. Sometime I think I could be an infographic as I’m regularly told, “You’re much smarter than you look”. In any case, we love them here at Onelargeprawn and decided to compile a small list of the ones that we particularly liked. Have a gander at them after the jump.
The Best Films of All Time

An in-depth infographic from French cinephile forum Vodkaster detailing the most critically acclaimed films of all time. Click through for the expanded image.
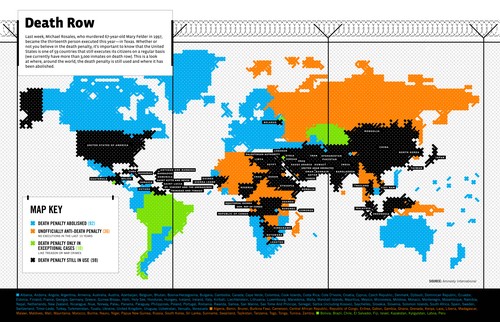
The Death Penalty Around The World

GOOD is an excellent non-profit magazine that has been using infographics in their “Transparency” section for quite a while. And in this particular one, they take a look at the countries that execute criminals on a regular basis. Click through for the expanded image.
How Many Nukes Will Destroy the World
By David McCandless. Read more about it at Information is Beautiful.

An interesting addition here is a short video from GOOD Magazine, that shows which countries have the nukes and how many they have. See it below.
Balancing Your Media Diet

You try to eat right, exercise, and live long. Wired Magazine thinks you should apply the same mentality when it comes to consuming media.
Mission to Mars

Designer Bryan Christie created this infographic showing all the past and future missions to Mars, starting with the Soviet Union’s Marsnik 1 in 1960. Find the expanded image here.
Incidentally National Geographic have a most excellent infographic detailing the 50 years of space exploration. Click through for the extremely large version.
The Billion Dollar Gram

Billion dollar amounts are spent here and there and David McCandless tries to create a living image of what it would look like. Click through for the expanded image.
Internet Censorship in China

Internet censorship can take many forms and most of them are implement in China, where the 340 million Internet users are the most heavily monitored. Read more about at Next Generation Online.
An Eye For an Eye
An Eye For an Eye is a satirical short film that uses only visual symbols to tell its story. It takes a look at the timeline of events that have unfolded since the 9/11 terrorist attacks and the conflict between the West and Islam.
The Trilogy Meter

Created by Dan Meth, the Trilogy Meter infographic is simple, showing his my enjoyment level of each film and nothing else.
LifeMap

Ritwik Dey charted out his life from age six to 24 as an infographic. Click through for the expand version.


3 replies on “10 Interesting Infographics”
I love infographics. They’re so cool. Have you seen that Eple music video that’s all infographics?
It’s been such an age since I watched “Remind Me”. I’m off to YouTube.
really cool info-graphics!! its a fast way to recognize information and its hard to make a good one. Nice list here :D